
Learn · Research notes
Dual momentum vs equal-weight of the same field
Locked dual-momentum rule on liquid asset-class ETFs, $500/month, 10 bps, 2002–2026. Beat live equal-weight by about +1.2pp TWR with a milder drawdown — INTERESTING, not a paid product.
Direct answer
On a diversified multi-asset menu without bitcoin, dual momentum beat equal-weight of the same live names by roughly +1.2 percentage points of time-weighted return and had a smaller max drawdown. It did not beat S&P 500 DCA, and the edge is not stable enough to sell.
The rule we locked (model C)
Among assets above their own 10-month moving average, hold the top two by 12-month return. If none qualify, sit in T-bills (BIL, else SHY). Lag-1. Full monthly rebalance for the research claim. $500 contribution. 10 bps base cost (not 25 — 25 was a stress test).
Universe (no bitcoin in the headline book): US equities, world ex-US / Europe / Japan / EM, Treasuries, gold, commodities — inception-clipped so equal-weight only uses live names each month.
Headline result (no bitcoin)
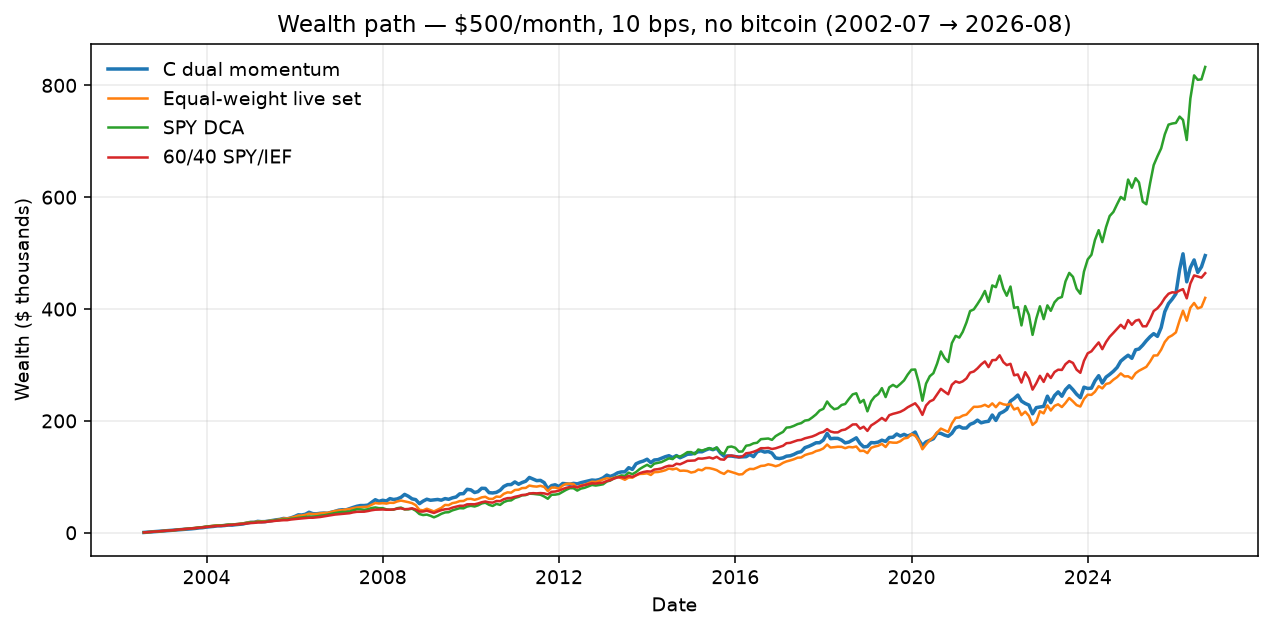
| Book | Final wealth | TWR | Max DD | |---|---:|---:|---:| | C dual momentum | ~$496k | 9.41% | −24% | | Live equal-weight | ~$420k | 8.21% | −34% | | SPY DCA | ~$833k | 11.23% | −39% | | 60/40 SPY/IEF | ~$464k | 8.25% | −19% |
C vs equal-weight: wealth ~+18%, TWR +1.20pp. C vs SPY: wealth ~−41%, TWR −1.8pp.
Do not market this as beating the S&P 500. Market it only as: a systematic tilt versus 1/N of the *same* menu — and even that we chose not to sell.
Rolling windows
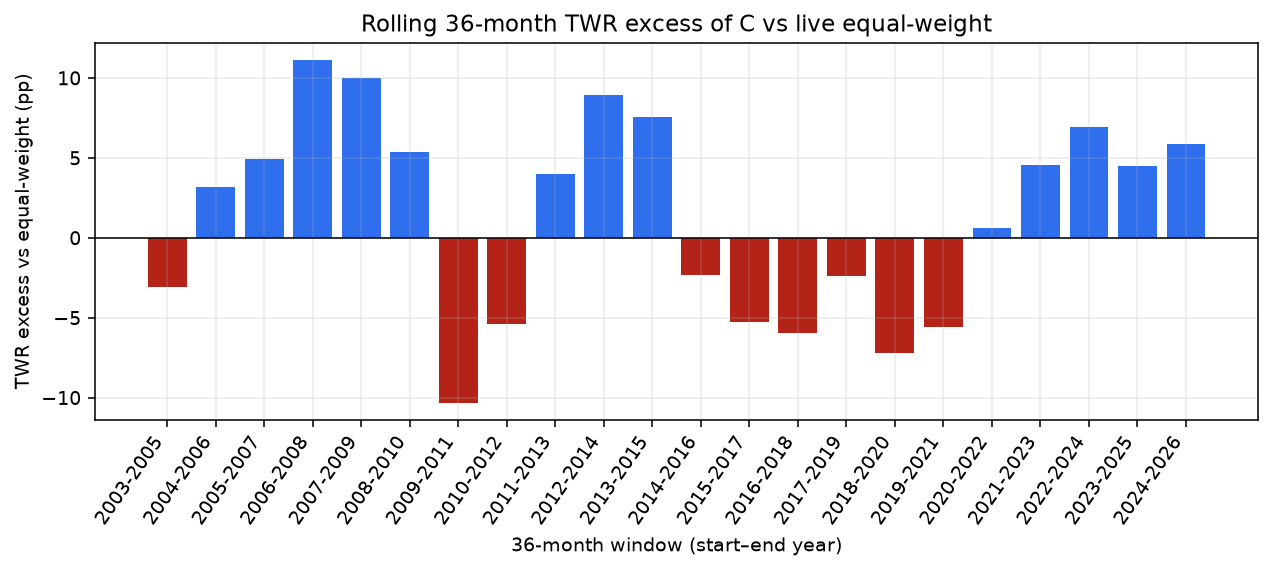
Hit rate ~59%, median TWR excess positive — above coin-flip, not “clearly dominant.” That is why the verdict stays INTERESTING, not PROMISING.
Where the book actually sat
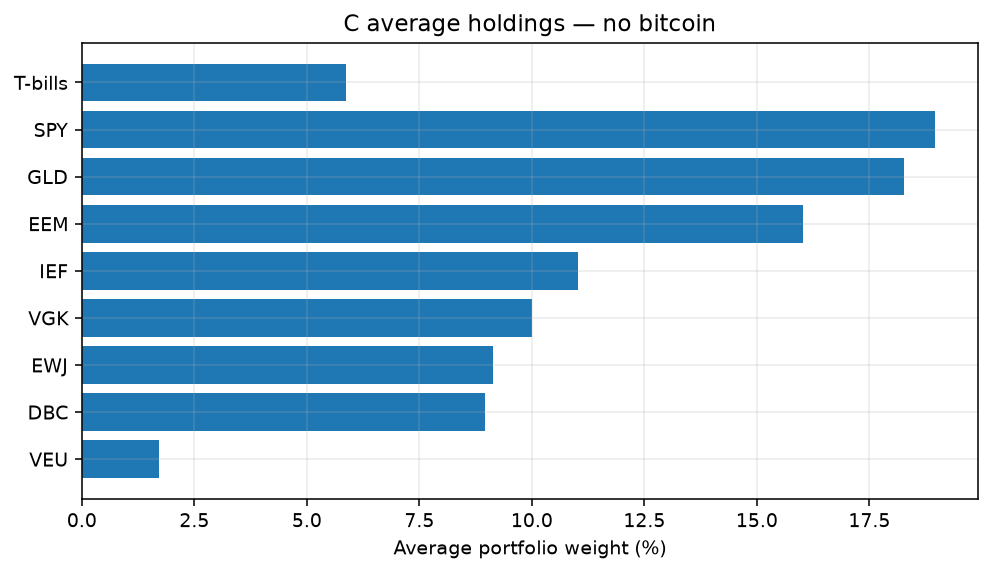
Roughly: SPY ~19%, gold ~18%, EM ~16%, Treasuries ~11%, Europe/Japan/commodities the rest, T-bills only ~6% of months. The edge is ranking among trending names, not hiding in cash.
Stress that matters
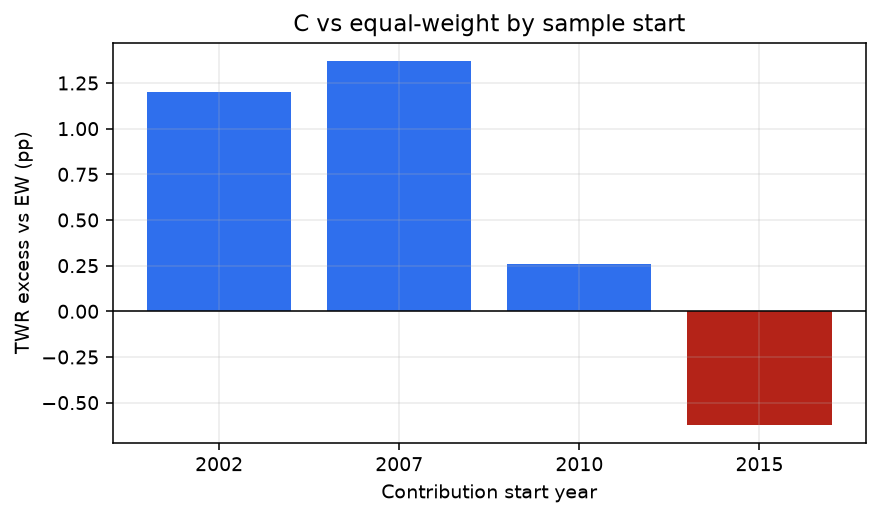
Start in 2015 and TWR vs equal-weight turns negative. Any sales page that only shows 2002–2026 is incomplete.
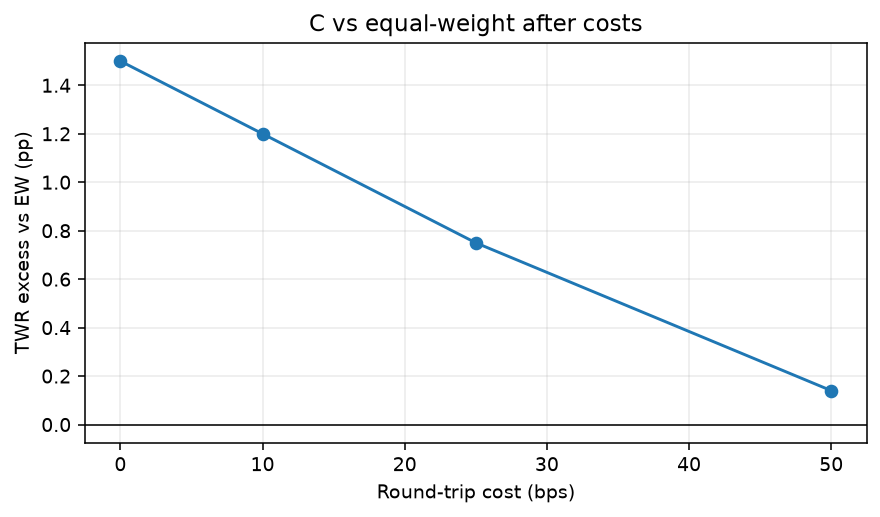
At 0 bps ~+1.5pp; at 10 bps +1.2pp; at 25 bps +0.75pp; at 50 bps the edge is gone. Liquid ETF books should assume low single-digit to ~10 bps — 25 bps is stress, not the base case.
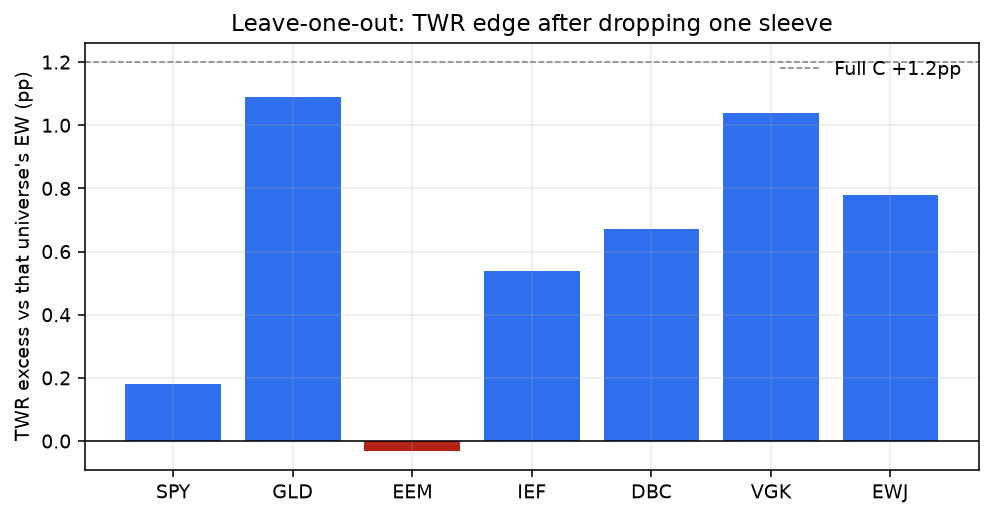
Dropping emerging markets removes the historical TWR bump vs 1/N. This is not a universal “any checkbox list” engine.
Placebo check (the part that is real)
C beat ~87% of random two-name books and 100% of random two-name books drawn only from names already in an uptrend. Ranking among trenders does work. Magnitude is the problem for a subscription.
Dual momentum research
The complete write-up with tables and caveats: Dual momentum across asset classes.
Frequently asked questions
- Dual momentum vs equal-weight of the same field?
- On a diversified multi-asset menu without bitcoin, dual momentum beat equal-weight of the same live names by roughly +1.2 percentage points of time-weighted return and had a smaller max drawdown. It did not beat S&P 500 DCA, and the edge is not stable enough to sell.
- Do you sell a trading strategy based on this research?
- No. These pages document what we tested and why we do not sell a paid allocator. Use the free S&P 500 DCA calculators instead.
Run the numbers on real history
Guides are cheap. Seeing a monthly habit on published S&P 500 prices is the point.