
Learn · Research notes
Why the bitcoin dual-momentum chart is not a product claim
Adding a BTC-USD price proxy makes dual momentum look like it crushes SPY. That path is not what an IBIT or UCITS buyer would have earned — and max drawdown jumps near −50%.
Direct answer
Including bitcoin as a research proxy inflates dual-momentum wealth and TWR. It is a bitcoin-concentration story, not a SteadyGrow allocator track record you can sell.
The chart people want to screenshot
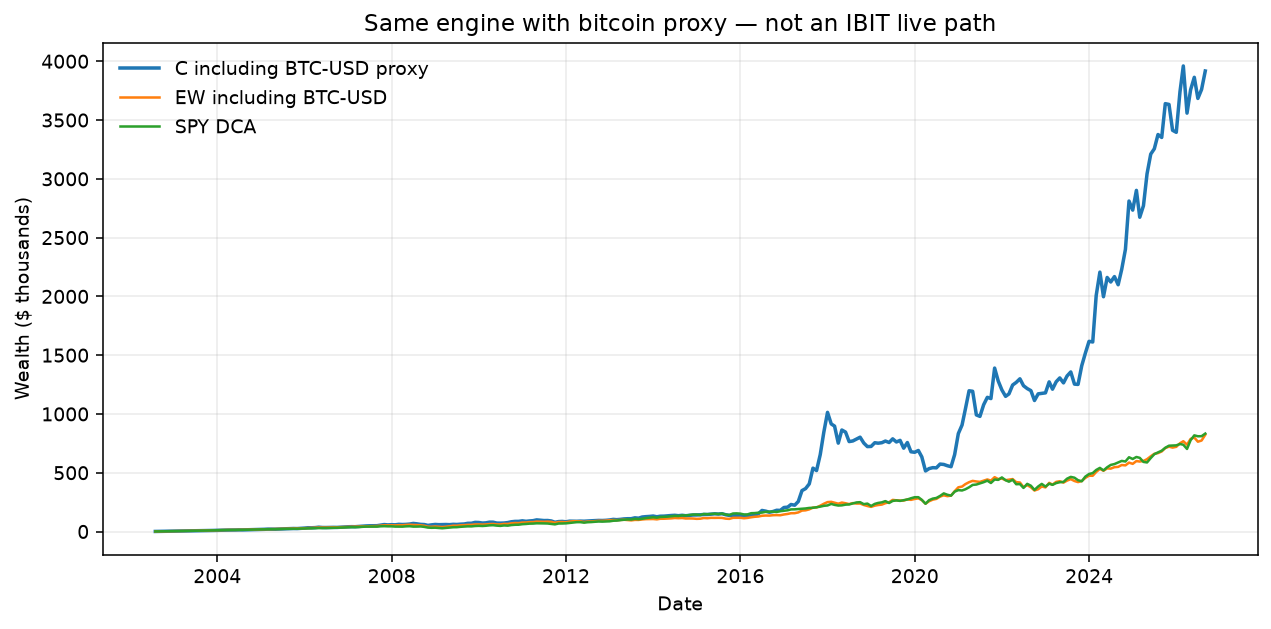
With a BTC-USD proxy from 2015, dual momentum can look like it crushes SPY and equal-weight. Average bitcoin weight in that book was on the order of ~14%. From 2015 onward the path is a bitcoin bull, not proof of a general allocator.
Why we refuse it as the headline
- BTC-USD ≠ IBIT / a UCITS ETP. Premium, tracking, inception, and taxes differ.
- Max drawdown ~−49% to −58% in those books vs ~−34% for equal-weight — a different risk product.
- Marketing that chart as “our monthly allocation system” would be dishonest.
What we do instead
- Bitcoin belongs in a user toggle with caps and warnings, or in a separate Bitcoin DCA calculator.
- The research headline book is without bitcoin. See dual momentum vs equal-weight.
Frequently asked questions
- Why the bitcoin dual-momentum chart is not a product claim?
- Including bitcoin as a research proxy inflates dual-momentum wealth and TWR. It is a bitcoin-concentration story, not a SteadyGrow allocator track record you can sell.
- Do you sell a trading strategy based on this research?
- No. These pages document what we tested and why we do not sell a paid allocator. Use the free S&P 500 DCA calculators instead.
Run the numbers on real history
Guides are cheap. Seeing a monthly habit on published S&P 500 prices is the point.