
Dual momentum across asset classes for a monthly contribution product
SteadyGrow research paper
As-of lock: 2026-09-04 (last complete month-end 2026-08-31)
Sample: 2002-07-31 → 2026-08-31
Status: INTERESTING, not PROMISING. Suitable as evidence for a preference-based allocator, not as “beats the S&P 500.”
Abstract
We test a locked dual-momentum rule on liquid US-listed asset-class ETFs, funded by a fixed $500 per month, with lag-1 signals and 10 bps costs. The rule (model C) keeps only names above their own 10-month moving average, then holds the top two by 12-month return. If nothing is in trend, the book sits in T-bills (BIL, else SHY) — a yield-bearing cash sleeve, not idle settlement cash.
On the eight-asset field without bitcoin, C beats a point-in-time equal-weight book on time-weighted return (+1.2 percentage points), finishes +18% richer, and has a milder max drawdown (−24% vs −34%). It beats 87% of random two-name books drawn from all live names and 100% of random two-name books drawn only from names already in an uptrend. Equal-weight is the right stand-in for “random weights” on the full field (1/N is their mean).
That is enough to say: on this field, over this sample, dual momentum is better than dart-throwing two names and a bit better than 1/N. It is not enough to say C is a reliable future picker. Starting contributions in 2015, TWR versus equal-weight is −0.62pp. Dropping emerging markets removes the edge. Top-3 fails. 50 bps almost wipes it. US-only and world-equity-only preference themes lose to their own equal-weight.
Bitcoin may be a user toggle. Including a BTC-USD price proxy from 2015 makes C look like it crushes SPY. That path is not what a UCITS/IBIT buyer would have earned. Always show the no-BTC book beside it.
Product sentence this paper supports
You choose the markets you are willing to own. Each month SteadyGrow sends the paycheck to the strongest of those markets that are still in an uptrend — or to T-bills if none are. We do not claim this beats the S&P 500.
1. Why this paper exists
Earlier SteadyGrow work (Phases 2–4) asked “which equity slice beats SPY?” Country momentum, sector contribution-only, full rotation, and SPY-core overlays failed that bar. Apparent wealth wins were often contribution-path effects or invent-cash.
Phase 5 changes the economic question:
- Not: sector A vs sector B (highly correlated).
- But: US equities vs international vs Treasuries vs gold vs commodities (different regimes).
The product that can use this result is not “our Smart Portfolio beats the index.” It is:
A system that turns a user-defined investment universe into a systematic monthly order.
This paper is the evidence pack for that value prop: what beat what, what failed, what we must warn users about.
Code and locked spec:
docs/superpowers/specs/2026-09-05-phase5-multi-asset-design.mdresearch/tactical_alloc/phase5.py,run_phase5.py,run_phase5_stress.py- JSON:
us_phase5.json,us_phase5_stress.json,us_default_book.json
2. Data, rules, and metrics
2.1 Universe (inception-clipped)
| Sleeve | ETF | Inception floor |
|---|---|---|
| US equities | SPY | 1993-01 |
| World ex-US | VEU | 2007-03 |
| Europe | VGK | 2005-03 |
| Japan | EWJ | 1996-03 |
| Emerging markets | EEM | 2003-04 |
| US Treasuries | IEF | 2002-07 |
| Gold | GLD | 2004-11 |
| Commodities | DBC | 2006-02 |
| Bitcoin (optional, proxy) | BTC-USD | 2015-01 |
| Cash / T-bills | BIL, else SHY | 2002-07 / 2007-05 |
A name is live only after its official inception. The equal-weight benchmark uses the same live set each month. That is the only fair “1/N” for a growing ETF menu.
Primary results exclude bitcoin unless a figure is labeled otherwise.
2.2 Locked models (no grid)
| Model | Rule |
|---|---|
| A | Equal-weight every live risk asset above its 10-month MA; else T-bills |
| B | Top 2 by 12-month return (ignore trend) |
| C | Among assets above the 10-month MA, top 2 by 12-month return; else T-bills |
| D | C, but drop names whose 60-month return is above the live median (“not expensive”) |
| E | Among trending names, combine high 12-month rank with low 60-month rank |
Book: full monthly rebalance, $500 contribution, lag-1 (signal at t−1, trade at t), 10 bps unless stated. D and E were locked before seeing results.
2.3 Benchmarks
| Benchmark | Role |
|---|---|
| Live equal-weight | Primary kill. “Could a dumb 1/N of the same menu do this?” |
| Random 2 live names | Dart throw with the same concentration as C |
| Random 2 trending names | Is ranking among uptrends doing work? |
| SPY DCA | Honesty check. Same paycheck, 100% S&P 500 |
| 60/40 SPY/IEF | Honesty check for Sharpe / sleep-at-night |
2.4 Metrics that matter
On a DCA path, (final / first month)^(1/T) is forbidden. We report:
- TWR — deposit-stripped time-weighted CAGR
- TWR excess vs the named benchmark, in percentage points
- Wealth ratio vs the same contribution schedule
- Max drawdown on the wealth path
- Sharpe on deposit-stripped monthly returns, rf = 0
- Rolling 36-month hit rate and median
- Annualized turnover
PROMISING (not met): TWR excess vs live EW > 0, rolling hit clearly above 50% with a non-negative median, drawdown not worse.
3. Headline backtest (no bitcoin)
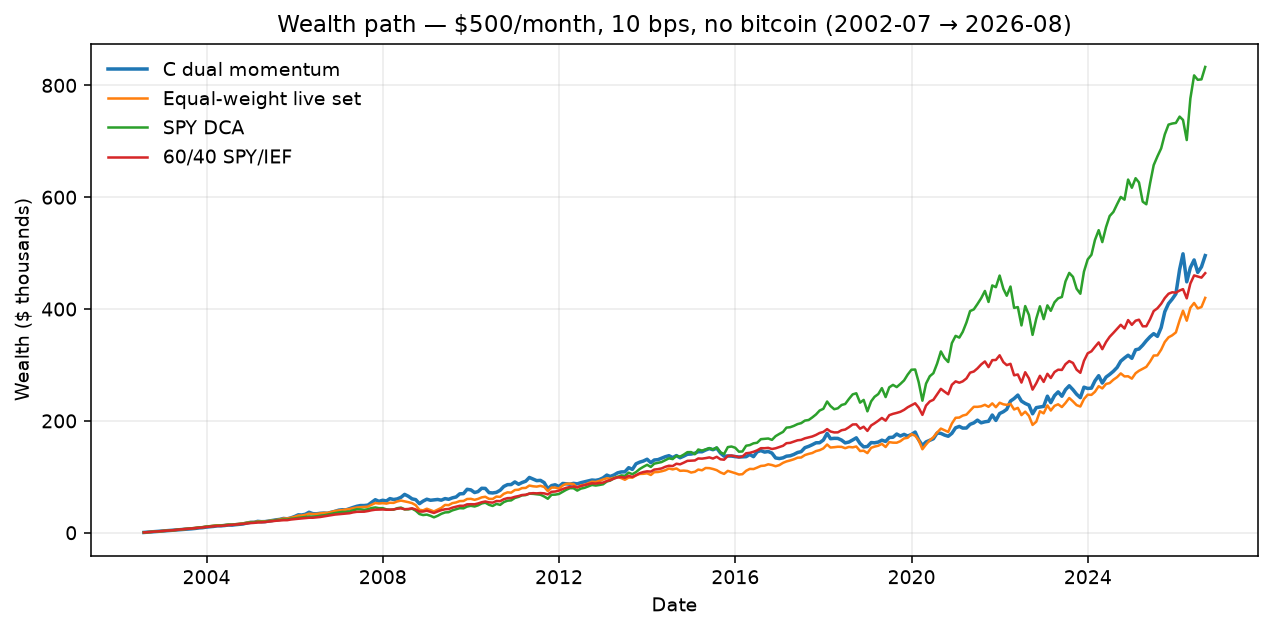
Figure 1. Same $500 every month. C is the solid dual-momentum book.
| Book | Final wealth | TWR | Sharpe | Max DD |
|---|---|---|---|---|
| C dual momentum | $495,562 | 9.41% | 0.74 | −24.2% |
| Live equal-weight | $419,966 | 8.21% | 0.72 | −33.8% |
| SPY DCA | $832,956 | 11.23% | 0.80 | −39.2% |
| 60/40 SPY/IEF | $464,167 | 8.25% | 0.93 | −19.3% |
C vs equal-weight: wealth +18.0%, TWR +1.20pp.
C vs SPY: wealth −40.5%, TWR −1.82pp.
C vs 60/40: wealth +6.8%, TWR +1.16pp, worse Sharpe and worse DD than 60/40.
Do not market C as a better Sharpe product than 60/40, or as an S&P beater. Market it as: a systematic tilt versus 1/N of the *same* menu, with a calmer path than 100% SPY and more growth than 60/40 in this sample.
3.1 Models A / B / C on the same field
| Model | vs EW wealth | TWR ex EW | vs SPY TWR | Max DD | Months in T-bills | Ann. turnover |
|---|---|---|---|---|---|---|
| A (all in trend) | +0.4% | −0.10pp | −3.11pp | −19.0% | 5.9% | 2.61 |
| B (momentum only) | +7.2% | +0.38pp | −2.64pp | −30.8% | 4.5% | 2.46 |
| C (dual) | +18.0% | +1.20pp | −1.82pp | −24.2% | 5.9% | 2.98 |
A fails the TWR gate. B is weaker than C. The interaction — trend first, then rank — is the live rule.
3.2 Where C actually sat
Figure 3. Average weights. Not a one-name bet.
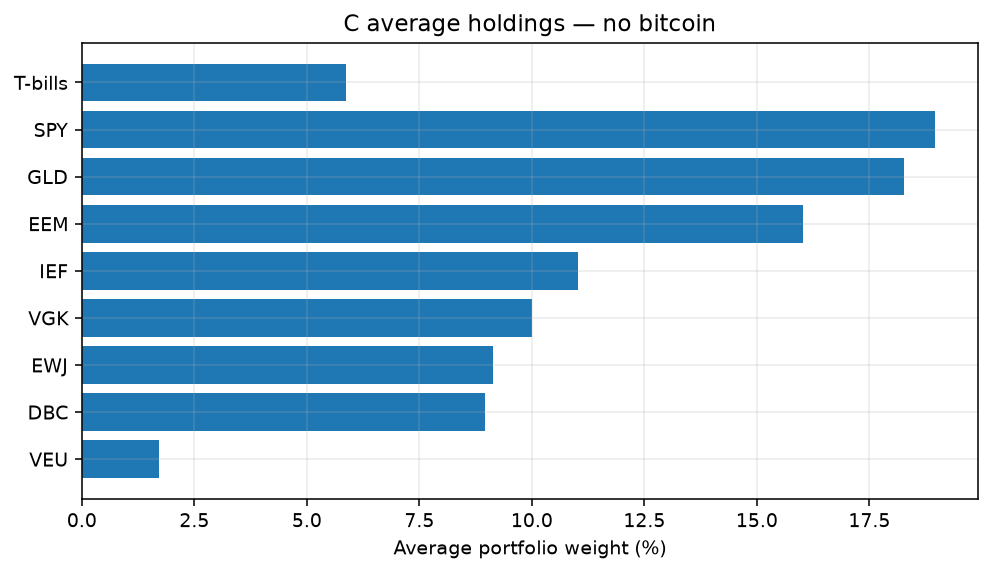
SPY 19% · gold 18% · EM 16% · Treasuries 11% · Europe 10% · Japan 9% · commodities 9% · T-bills 6%.
T-bills are on only 6% of months. Most of the edge is which two trending names, not “hide in cash.”
4. Is C better than random?
This is the table that supports the product line “not a dart throw.”
| Comparison | Result |
|---|---|
| C vs equal-weight of the live set | Wealth +18%, TWR +1.2pp, rolling TWR hit 59%, median +3.6pp, DD −24% vs −34% |
| C vs random 2 from all live names (30 seeds) | C beats 87% of seeds. Random mean wealth vs EW: −8.9% (worse than 1/N) |
| C vs random 2 already in an uptrend | C beats 100% of seeds. Random mean −8.8%. Ranking among trenders is the work |
| Random full-universe weights | Not a separate test. 1/N is the mean of those weights. C vs EW is that comparison |
Concentrating at random is worse than spreading 1/N. C’s concentration is the opposite: it helps on this field. That is the statistical claim we can print.
We cannot print: “this will beat 1/N next decade.” See Section 6.
5. Rolling windows
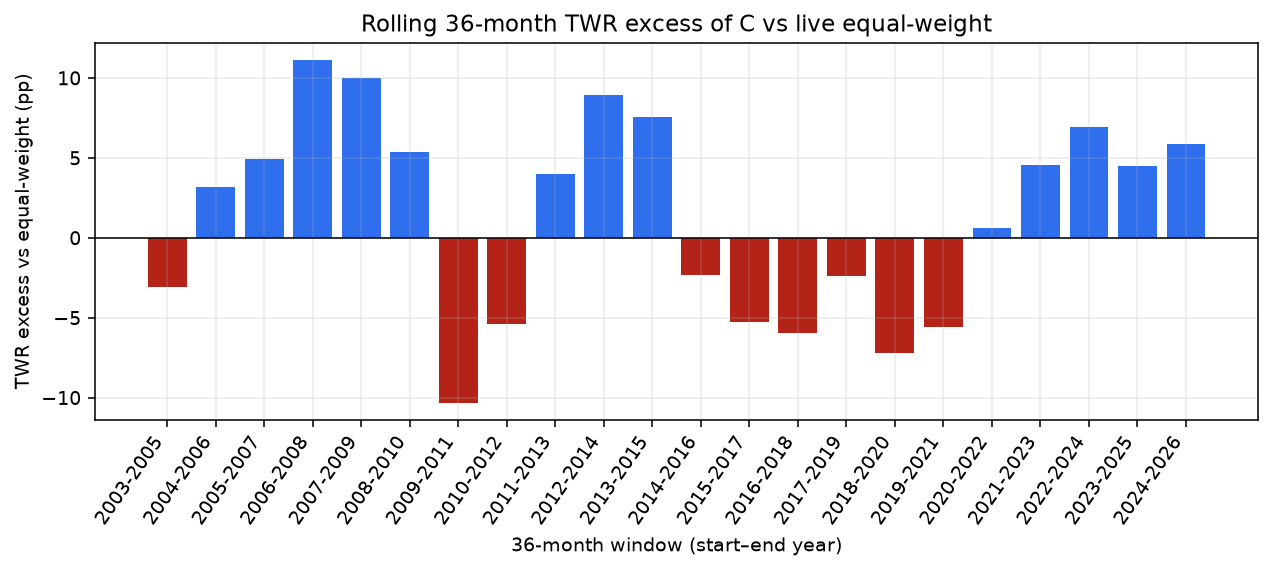
Figure 2. Overlapping 36-month tests, contribution starting each January 2003–2024 (n = 22).
| Wealth vs EW | TWR vs EW | |
|---|---|---|
| Hit rate | 59.1% | 59.1% |
| Median | +3.73% | +3.58pp |
| Mean | — | (right-skewed; a few strong windows) |
59% is above 50% and the median is positive. It is not “clearly above 50%” in the PROMISING sense. Extra TWR is lumpy. That is why the verdict stays INTERESTING.
6. Stress tests (why this is not proven alpha)
6.1 Sample start
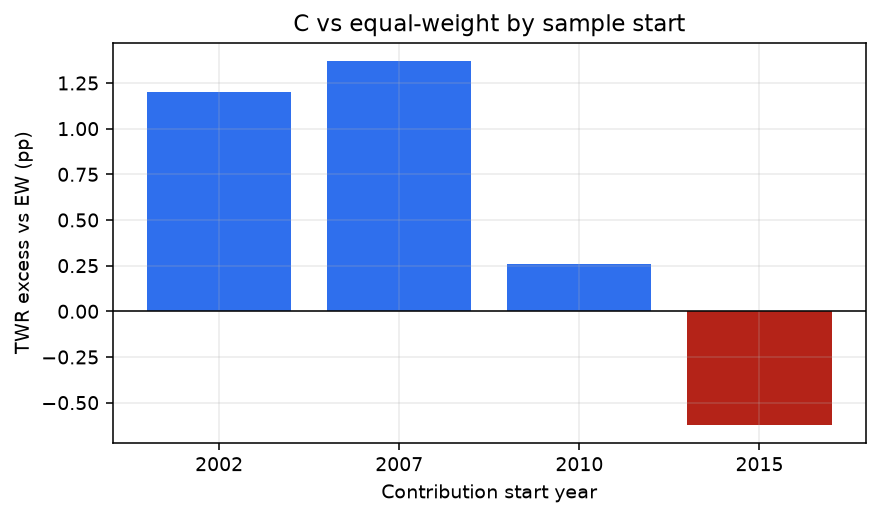
Figure 4.
| Contribution starts | vs EW wealth | TWR excess | Max DD |
|---|---|---|---|
| 2002-07 (full) | +18.0% | +1.20pp | −24.2% |
| 2007-05 | +9.4% | +1.37pp | −15.7% |
| 2010-01 | +9.5% | +0.26pp | −12.6% |
| 2015-01 | +9.3% | −0.62pp | −11.2% |
The recent decade does not confirm the full-sample TWR edge. Any sales page that only shows 2002–2026 is incomplete.
6.2 Costs
Figure 5.
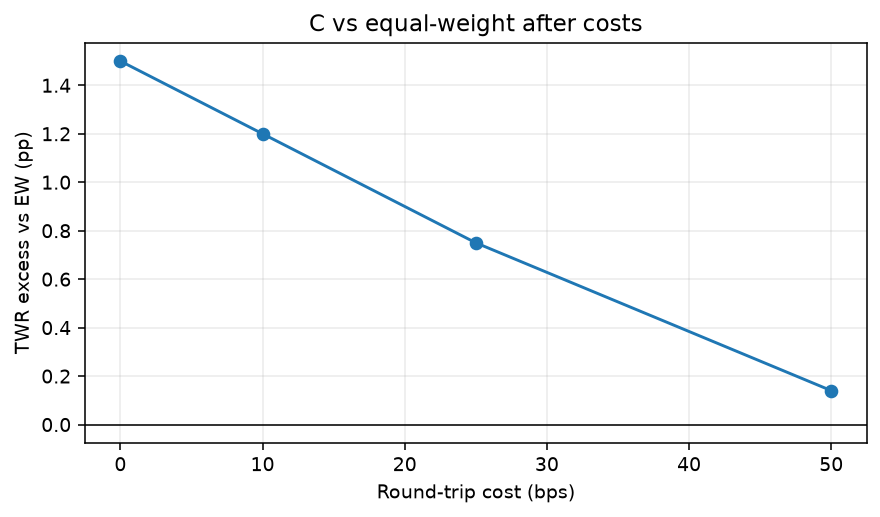
| Cost | vs EW wealth | TWR excess |
|---|---|---|
| 0 bps | +23.6% | +1.50pp |
| 10 bps | +18.0% | +1.20pp |
| 25 bps | +10.3% | +0.75pp |
| 50 bps | +1.2% | +0.14pp |
Retail ETF spreads plus a round-trip can live near 10–25 bps. 50 bps kills the TWR edge. The product must use cheap, liquid sleeves.
6.3 Leave-one-out
Figure 6.
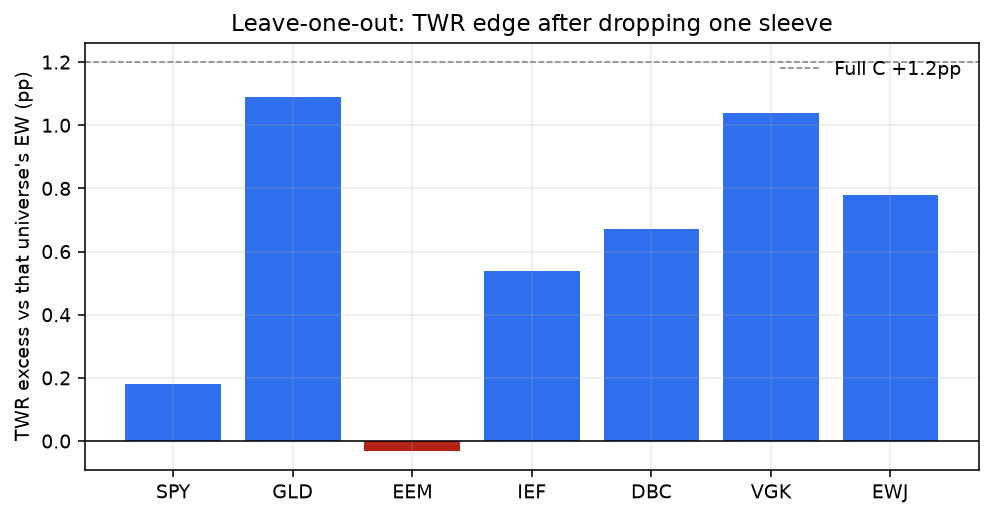
| Sleeve removed | TWR excess vs that universe’s EW |
|---|---|
| (none — full C) | +1.20pp |
| Gold | +1.09pp |
| Europe | +1.04pp |
| Japan | +0.78pp |
| Commodities | +0.67pp |
| Treasuries | +0.54pp |
| US (SPY) | +0.18pp |
| Emerging markets | −0.03pp |
The edge is not “just gold.” It is sensitive to EM. Warn users who exclude EM that the historical TWR bump vs 1/N may disappear.
6.4 Top-N
| Top N | vs EW wealth | TWR ex | Rolling TWR hit | TWR median |
|---|---|---|---|---|
| 1 | +11.0% | +0.30pp | 50.0% | +0.84pp |
| 2 (locked) | +18.0% | +1.20pp | 59.1% | +3.58pp |
| 3 | −1.3% | −0.12pp | 54.5% | +0.45pp |
Top-2 was specified before the horse race. Top-3 failing is useful: the rule is not “the more names the better.” Treat N=2 as a fragility, not something to re-optimize live.
6.5 Preference-like themes
Figure 7. C versus that theme’s own equal-weight — the test that matters if users tick a subset.
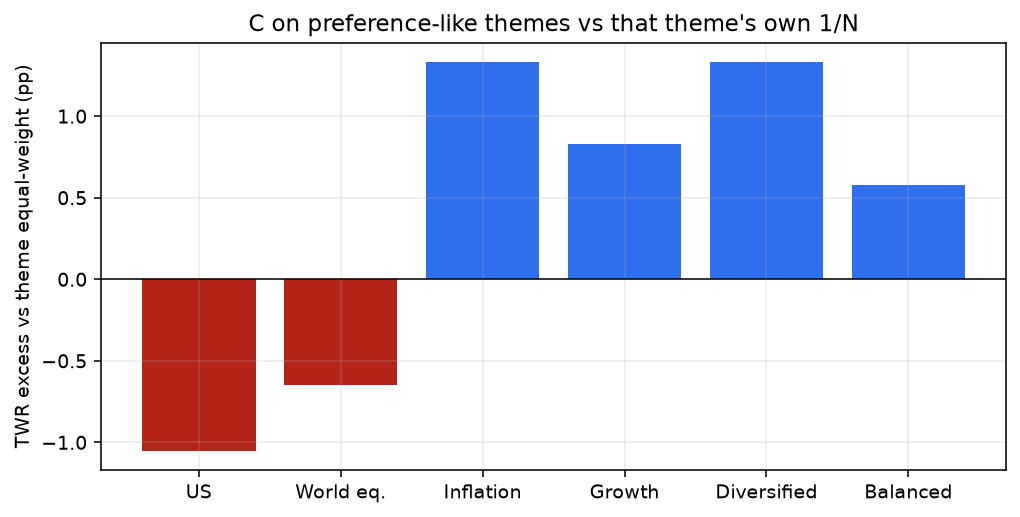
| User-like field | Names | vs own EW | TWR ex | Rolling TWR hit / median | vs SPY TWR |
|---|---|---|---|---|---|
| US | SPY, QQQ, IEF, GLD | −3.2% | −1.05pp | 45.5% / −0.34pp | −1.24pp |
| World equities | SPY, VGK, EWJ, EEM | −12.5% | −0.65pp | 40.9% / −1.35pp | −3.00pp |
| Inflation | GLD, DBC, SPY, IEF | +28.9% | +1.33pp | 54.5% / +2.29pp | −2.02pp |
| Diversified | SPY, IEF, GLD, DBC | +28.9% | +1.33pp | 54.5% / +2.29pp | −2.02pp |
| Growth | SPY, QQQ, EEM | +35.9% | +0.83pp | 68.2% / +1.76pp | +2.25pp |
| Balanced | SPY, VGK, IEF, GLD | +14.8% | +0.58pp | 54.5% / +2.85pp | −2.01pp |
If the user only wants US names, or only world equities, we do not have evidence that C beats 1/N. In those cases the product should equal-weight, or say “we don’t have an allocation edge on this field,” not run dual momentum anyway.
A user who is SPY-only has a field of one. C cannot allocate. The offer is Simple DCA: €500 SPY every month. That is the free comparison line, not a smart book.
6.6 Contribution-only (product-faithful book)
New cash → current top-2; sell a holding only when its own trend breaks.
| vs EW wealth | TWR ex | Rolling TWR hit | TWR median | Max DD | |
|---|---|---|---|---|---|
| C full rebalance | +18.0% | +1.20pp | 59.1% | +3.58pp | −24.2% |
| C contrib + trend-exit | +47.5% | +1.87pp | 50.0% | +0.46pp | −33.0% |
Full-sample wealth looks better if we never trim leftovers. Rolling consistency is worse. For a research claim vs 1/N, full rebalance is the cleaner rule. For the live product, contrib+exit is closer to “this month’s paycheck” and should be shown as a book option, not as the stronger statistical result.
6.7 Mean reversion overlay (D / E) — failed
The fear “we overweight the name after a long bull” is valid (momentum crash / 12–24 month time-series reversal in the literature). We locked two slow/cheap rules. Both hurt TWR and rolling hit (~41%).
| Model | vs EW | TWR ex | Rolling TWR hit |
|---|---|---|---|
| D (skip 5y-expensive) | −1.6% | −0.98pp | 40.9% |
| E (fast mom + slow washout) | +5.2% | −1.02pp | 45.5% |
Do not add a mean-reversion model we already tested and failed. Mitigate with user-visible caps and warnings, not a second signal.
7. Bitcoin (optional sleeve)
Figure 8. Same engine, BTC-USD as a research proxy from 2015. This is not an IBIT/UCITS live track record.
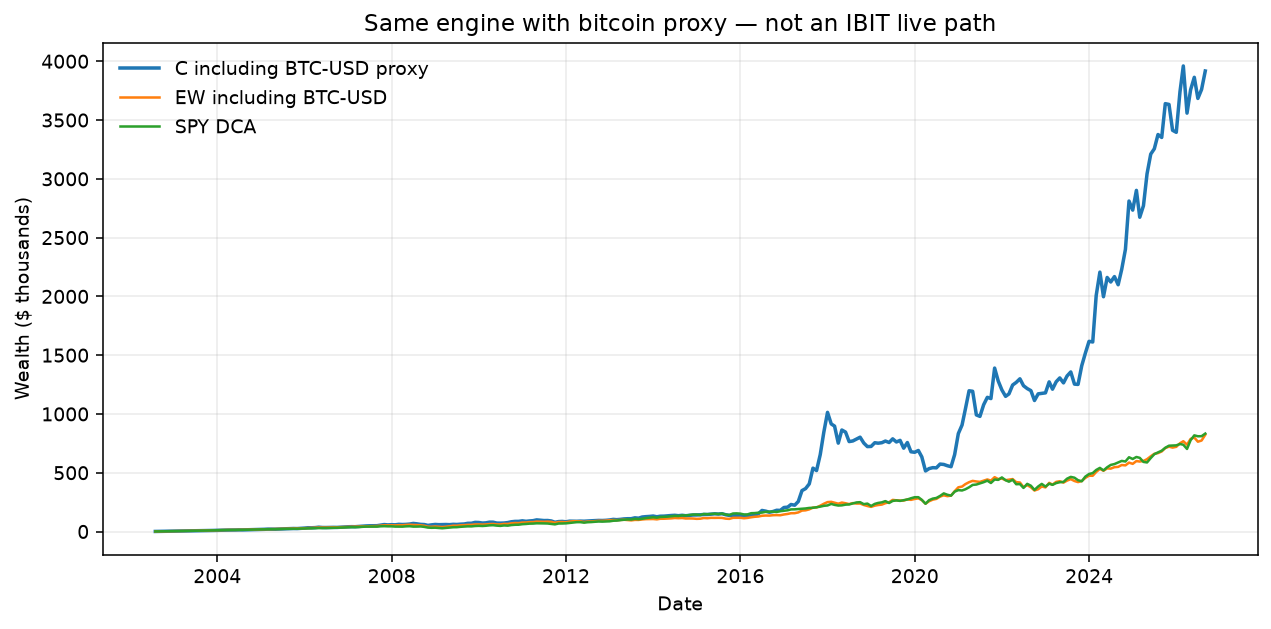
| Book (2002–2026) | Wealth | TWR | Sharpe | Max DD |
|---|---|---|---|---|
| C + BTC-USD proxy | $3.92m | 20.3% | 0.88 | −49.2% |
| EW including BTC-USD | $0.82m | 11.9% | 0.91 | −33.8% |
| SPY DCA | $0.83m | 11.2% | 0.80 | −39.2% |
| 60/40 | $0.46m | 8.3% | 0.93 | −19.3% |
Average BTC weight in C: 13.6%. From 2015 (when the proxy is live): C TWR 31% vs SPY 14% — a bitcoin bull, not a proven allocator.
Product rule: bitcoin is a user toggle, default on if they want it, with:
- a second chart “same book, bitcoin off”
- a cap (user-set; we suggest 15–20% and warn above that)
- copy that the backtest used a price index, not the ETF they will buy
8. Product mechanics this research implies
8.1 T-bills are not “do nothing”
“Go to T-bills if nothing is in trend” is not the same as leaving euros in a checking account.
| Settlement cash | T-bill / money-market ETF (what we tested) | |
|---|---|---|
| Yield | ~0 (or bank leftover) | T-bill yield (BIL/SHY in the backtest) |
| Same paycheck? | Yes | Yes |
| Invent cash later? | No | No |
| In the engine | Only if we cannot buy BIL/SHY | This is the risk-off sleeve |
For the monthly card, say:
Nothing in your universe is in an uptrend. This month’s €500 goes to [BIL / a EUR money-market / short government] until a sleeve is back above its trend.
If the user’s broker cannot buy that sleeve, cash this month is the fallback — disclose the extra cash drag versus the backtest.
Weekly vs monthly: the research bar is month-end. A weekly reminder can repeat the same month’s order. Do not invent a weekly signal we did not test.
8.2 Preference filters and correlation warnings
ESG, no weapons, accumulating, EUR-hedged, Sharia are catalog filters: they pick *which* ETF stands for “US” or “World.” They are not extra momentum factors.
After mapping, collapse to one sleeve per asset class. If the screen leaves four overlapping ESG world funds, treat them as one sleeve or C is ranking highly correlated twins — the case where C already lost (US / world-equity themes).
Warn (do not hard-block) when:
| Condition | Warning |
|---|---|
| Only one sleeve | “This is Simple DCA. There is nothing to allocate.” |
| All sleeves are equity regions | “On US-only and world-equity-only fields, dual momentum lost to equal-weight. We will equal-weight unless you add another asset class.” |
| Pairwise 36-month return correlation > 0.8 across all selected sleeves | “Your menu moves together. The historical edge vs 1/N was not found on menus like this.” |
| EM excluded | “Removing emerging markets removed the historical TWR edge vs 1/N.” |
| Bitcoin on, no cap or cap > 25% | “A long BTC uptrend can dominate the book. Historical max DD with an uncapped proxy was about −49%.” |
| Top-1 concentration (user sets N=1) | “Top-1 was weaker and less stable than top-2 in sample.” |
Suggested default if they ignore warnings: still let them proceed (their preference), but the monthly card shows C and 1/N of their field so they can see the difference.
8.3 Caps — user decides, we warn
Do not hide a 15% BTC cap as if it were the science. Show:
- Suggested cap (15–20% any single sleeve; 25% hard-warn)
- Their choice
- A one-line impact: “With a 20% cap, bitcoin cannot be 50% of the book after a multi-year run.”
Same for “100% in the current #1.” Default N=2. If they want N=1, warn using Section 6.4.
8.4 What we can put on a landing page (and what we cannot)
Allowed (this paper):
- On a diversified menu of major asset classes, 2002–2026, same monthly savings: dual momentum beat equal-weight by +1.2pp TWR, beat random two-name picks, and had a smaller drawdown than 1/N.
- Ranking among names that are already uptrending beat picking those names at random (100% of seeds).
- If nothing is in trend, the paycheck can sit in T-bills.
Not allowed:
- “Beats the S&P 500”
- “Better Sharpe than 60/40”
- “Works on any ESG / style / hedged subset”
- “Works if you only want the S&P”
- The bitcoin-proxy wealth path as a live live track record
- “Proven to work after 2015” (TWR vs EW is negative)
9. Limitations
- ETF era only — no 1970s–1990s futures trend book.
- Yahoo adjusted closes — good enough for research, not a TCA.
- BTC-USD ≠ IBIT / a UCITS ETP — premium, tracking, and inception differ.
- 22 rolling windows — small; 59% hit is noisy.
- Top-2 locked but unique — top-3 fails; treat as fragile.
- EM-sensitive — not a generic “any eight tickers” result.
- Long-only, no leverage, no shorts — weaker than CTA literature.
- Preference filters untested — only coarse themes.
- Mean-reversion add-ons failed — late-cycle overweight remains a disclosed risk.
10. Conclusion
We have actual research for this sentence:
Dual momentum, on a diversified set of major asset classes, was better than picking two names at random and a bit better than equal-weighting the same menu, with a milder drawdown — in 2002–2026, same paycheck, after 10 bps. It did not beat the S&P 500. It did not beat 60/40 on Sharpe. It did not work on equity-only menus. It did not hold up if you start in 2015. Bitcoin, if the user wants it, is a cap-and-warn sleeve, not the headline chart.
That is an honest research conclusion — not a product pitch. SteadyGrow stays free calculators and notes: understand the past; do not sell a fragile edge as a subscription.